Bitcoin Technical Snapshot: Range Holds Near 90k
Bitcoin (BTCUSD) is trading near 90,749, with price stuck inside a consolidation band around 86k–94.8k.

Bitcoin Technical Snapshot: Range Holds Near 90k
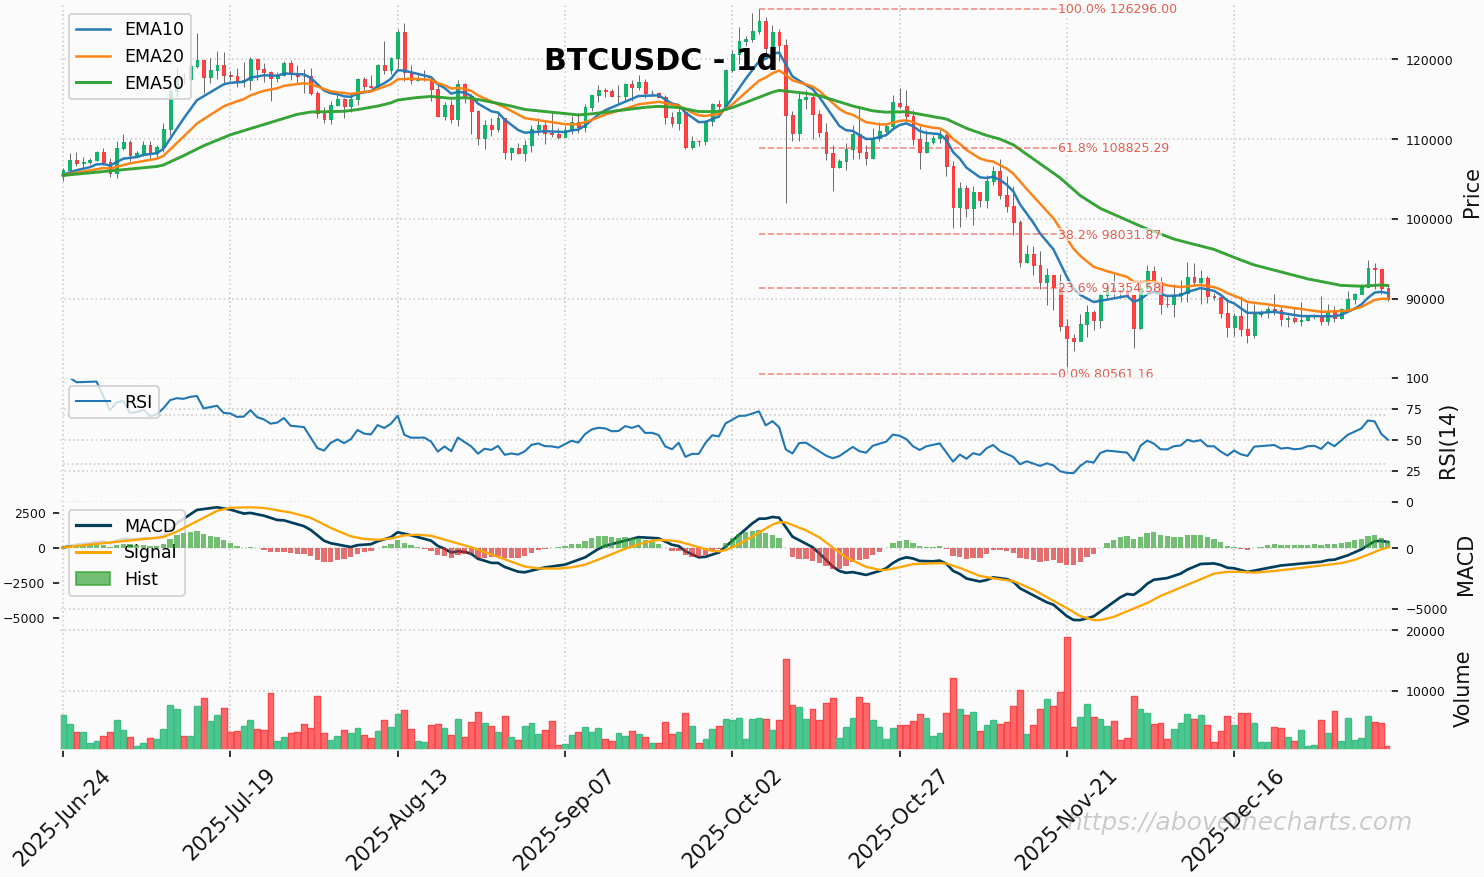
TL;DR: Bitcoin (BTCUSD) is trading near 90,749, with price stuck inside a consolidation band around 86k–94.8k. Short-term momentum looks constructive—RSI ~63 and MACD bullish—while the mid- and long-term trend remains bearish: the moving-average stack (EMA200 > EMA50 > EMA10 > EMA20) and price remain well below the 200-day SMA. Key near-term levels cluster between 90.31k–92.50k (support and resistance including pivot, Fib 0.236 and R1–R3). ADX (~29.6) implies trend strength when price breaks these clusters. Daily closes beyond S2 or R3 may provide clearer directional bias.
Why this matters now
Bitcoin (BTCUSD) is trading around 90,749 and remains within a clearly defined range. The near-term question is whether the market resolves the consolidation to the downside (in line with the multi-month downtrend) or extends the recent bounce. The technical picture shows short-term bullish momentum within a longer-term bearish structure, a rally-in-a-downtrend configuration.
Market snapshot
Last close: 90,749
Data window: 2025-06-23 → 2026-01-08 (200 daily bars)
Current phase: consolidation inside a broader downtrend
Recent range: 86,000–94,800 (≈9.7% width)
Price sits in the mid-to-lower half of that band, just beneath a tight resistance cluster formed by daily pivots and a Fibonacci 0.236 retracement.
Key levels: support and resistance
Technical levels converge closely, defining clear interest zones:
Immediate support cluster: 90,311–90,443 (S1 + horizontal cluster). This confluence has seen many tests and is the most reliable short-term support.
Next supports: 89,875 (S2) and layered horizontal clusters at 89,229, 88,622, 88,015 and 87,408.
Immediate resistance cluster: 91,355–92,495 (Fib 0.236 at 91,354; daily pivots R1–R3). A daily close above R3 (~92,495) could shift the balance of the range.
Higher Fibonacci resistances: 98,032 (0.382) and 108,825 (0.618) are the next notable overhead barriers if price can sustain above the local cluster.
Daily pivots (for reference): Pivot = 90,966; R1 = 91,404; R2 = 92,058; R3 = 92,495; S1 = 90,312; S2 = 89,875; S3 = 89,220.
Trend and indicator read
The multi-horizon view is mixed:
Short-term: positive momentum (RSI 63.6; MACD strongly positive; EMA10 and EMA20 sloping up).
Mid-to-long-term: bearish (EMA200 and EMA50 are above price and sloping down; SMA200 ~106,505 remains well overhead).
ADX ~29.6 indicates a moderate trend environment—when price decisively breaks nearby clusters, the move can extend.
Bollinger Bands are not in a squeeze; the basis (~89,225) sits below the current price while the upper band (~93,407) is above the local resistance cluster. Stochastic shows a neutral-to-bearish cross, underscoring mixed momentum.
Volume context
Notable volume events during the period:
2025-10-10: high-volume breakdown on a large drop.
2025-11-21: capitulation-like sell climax near ~85k with multi-month high volume.
2025-12-01: elevated sell volume during a retest around ~86.3k.
Those volume spikes mark areas of significant market participation and help validate the layered supports near the 86k–90.5k region.
Risk/reward map and scenario framing
The technical map highlights three operative scenarios without prescribing actions:
Range continuation: Price oscillates between ~86k and ~94.8k. The daily pivot (~90,966) is the local midpoint and a likely locus for whipsaws while the range holds.
Breakout to the upside: A convincing daily close above R3 (~92,495) could reduce the near-term range thesis and bring the Fib 0.382 area near ~98k into focus as the next reference zone.
Breakdown to the downside: A sustained close below S2 (~89,875) would undercut the immediate support cluster (90.31–90.44) and invite tests of 89.23, 88.62 and lower horizontal clusters.
The closest breakout watch is R2 (~92,058), only ~1.4% above the last price; the nearest breakdown watch is S1 (~90,312), only ~0.5% below.
Conflicts and how to interpret them
There is a clear conflict between short-term momentum (bullish MACD/RSI) and the prevailing mid/long-term bearish structure (bearish MA stack and price below SMA200). The analysis gives greater weight to the broader trend: short bursts of strength should be interpreted as rallies within a downtrend until price makes higher highs and the moving-average stack shifts.
ADX above 25 suggests that once price moves beyond the tight clusters, the ensuing move has a reasonable chance to carry further in that direction.
What to watch next
Daily closes relative to S2 (89,875) and R3 (92,495) for potential invalidation or confirmation of the range.
Volume accompanying any break: extensions on higher volume add conviction to a breakout or breakdown.
Shifts in structure: a sustained move that creates higher highs and shifts the MA stack (EMA50 crossing below/above EMA200, etc.) would change the mid/long-term bias.
This is a technical read, not a recommendation. It summarizes observed price structure, indicator readings, pivot and Fibonacci levels, and volume context to clarify where market participants have concentrated interest.
Takeaway
Bitcoin is trading inside a well-defined consolidation band near 90.7k. Short-term momentum is constructive, but the multi-month downtrend remains intact. The immediate battle is between a tight support cluster around 90.31–90.44 and a resistance cluster spanning roughly 91.35–92.50. ADX suggests moves beyond those clusters can extend until one of those daily-close thresholds is breached with confirming volume, expect range dynamics and the potential for whipsaws around the daily pivot.
Disclaimer — Not Financial Advice
The content provided in this article, including all charts, technical analysis, price levels, indicators, opinions, and forward-looking statements, is for informational and educational purposes only. It does not constitute financial advice, investment advice, trading advice, or any other form of professional recommendation.
Financial markets are highly volatile and involve significant risk, including the potential loss of capital. Past performance is not indicative of future results. Any reference to price levels, scenarios, or market outlooks reflects a technical interpretation at the time of writing and may change without notice.
Readers are solely responsible for conducting their own research and making independent decisions. Always consider consulting with a licensed financial advisor or other qualified professional before making financial decisions.
By reading this publication, you acknowledge that the author and publisher are not liable for any losses or damages arising from the use of this information.